


The initiative started in 2012 with a series of international conferences held in cities from the TFT Port Network (Belfast, Manila, Ciawi, Valencia, and Geneva). Thereafter, the Port Performance Scorecard (PPS) has gone through tremendous changes and upgrades to respond to four main technical requests from port members. Indeed, the new pps.unctad.org website now features (1) a more user-friendly interface, (2) incorporated data consistency checks, (3) an automated past-entry function, and (4) advanced analysis tools by regions and categories with automated graphics and filters. The process captures data through annual surveys (starting with year 2010) sent to focal points in each port entity around April to report for the previous calendar year.
Key elements – Scorecard 2016–2020
Scorecard in Details
Finance
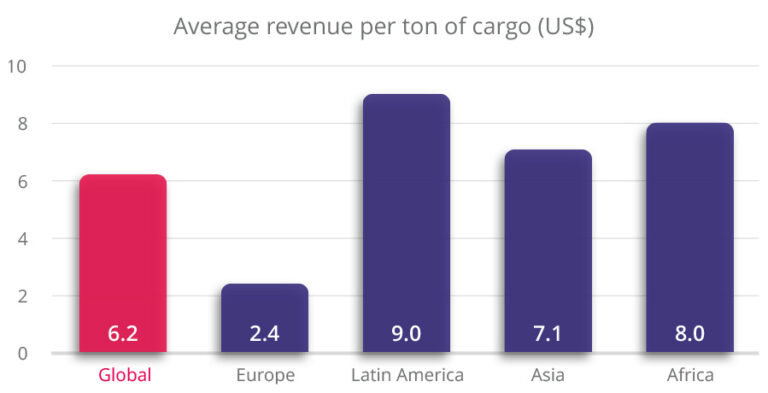
Financial performance of ports can be measured as the average gross revenue per tonne of cargo, having the global average of $6.2 in 2020. This ranged from $2.4 per tonne in Europe, to $9.0 per tonne in Latin America.
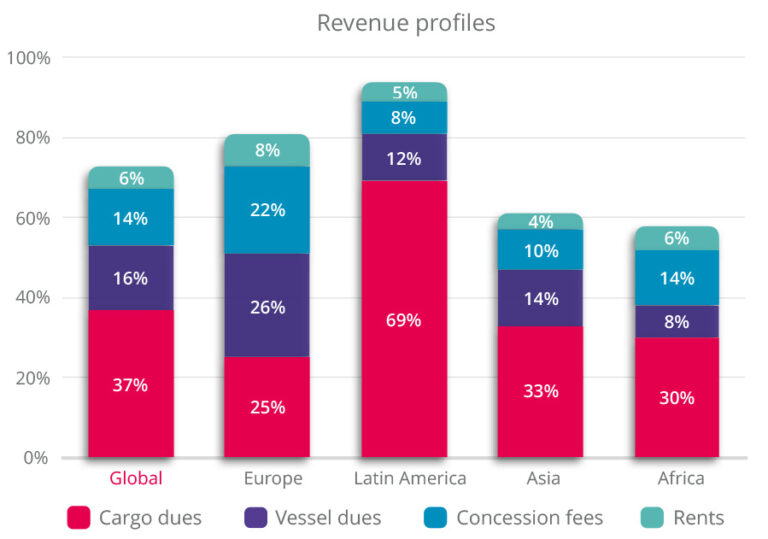
Looking at the split between port dues on vessels and cargo throughput, port service charges, and income derived from land and concession rights across different regions, there are quite big differences in income profiles of ports across the regions. Ports in Europe seem to have quite balanced income profiles, while for example in Latin America the main income comes from the cargo dues.
Pandemic impacts
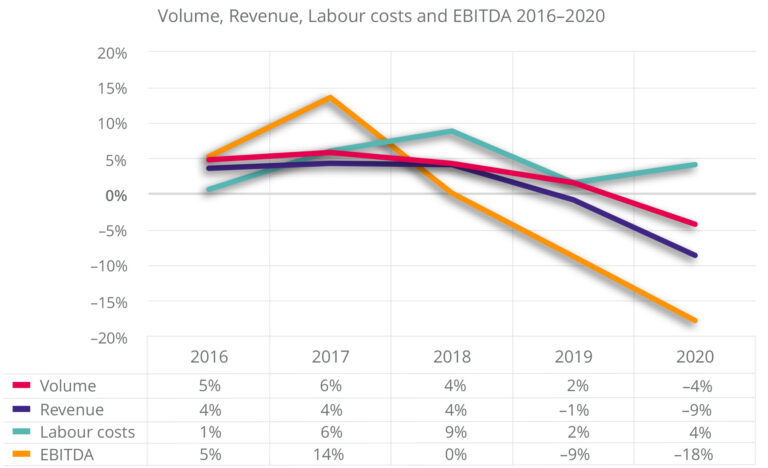
In 2020, the COVID-19 pandemic had a significant impact on ports worldwide. As well as creating health risks for port workers and seafarers in all regions it also substantially reduced the volume of trade. Between 2016 and 2018 cargoes had been growing at a median value of five per cent per year and revenues by six per cent. In 2020, however, volumes fell by 4 per cent and revenues by 9 per cent. Median profitability measured as earnings before interest, taxes, depreciation, and amortization (EBITDA), being less stable over time, fell by 18 per cent in 2020 alone. In performance terms, the reported numbers show a falloff in 2020. While there have been profitability drops in other periods this decline can be partially explained by the COVID-19 pandemic.
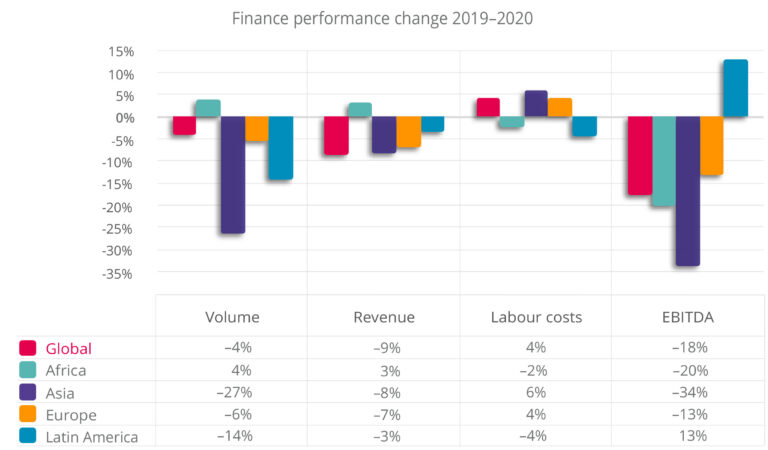
The trend in revenue levels in 2020 as against 2019 are less clear. In Europe the fall in median revenue at 7% is consistent with the fall in volume. In Asia the decline in median revenue is at only 8%, while the drop in volume is more pronounced at a 27% reduction. Africa reported higher median revenues of 4%, which is marginal with little evidence of a pandemic impact. Latin America reported a median revenue decline of 3%, which is much less than the reported volume decline of 14%. It is not clear from these returns how much of this revenue fall can be attributed to the effects of the pandemic.
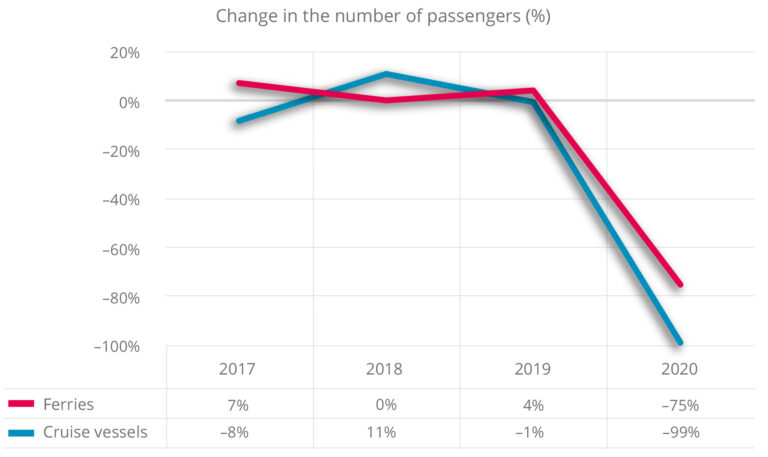
One of the most direct impacts of COVID-19 was on cruise and ferry services. As observed with the median value across all the reporting ports, the cruise operations practically stopped for most of the ports. Number of ferry passengers also dropped significantly by 75 %.
Cargo operations
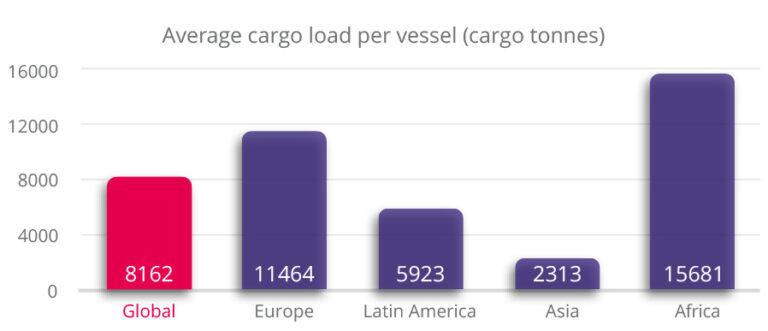
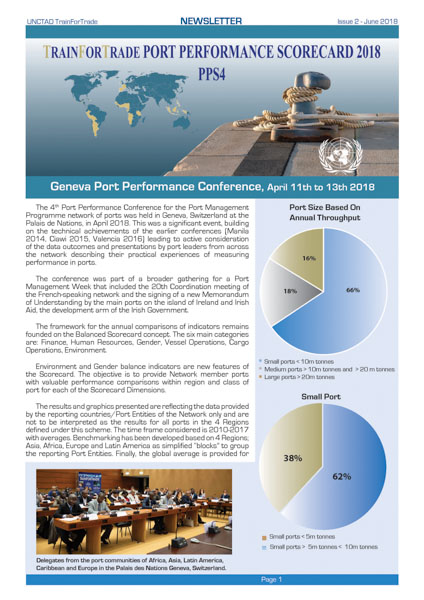
PPS data provide interesting insights into the differences between regions. At the global level, between the last year (2015–2019) and the current (2016–2020) scorecard, the average cargo load per vessel per arrival rose from 7,865 to 8,162 tonnes, a 3.9% increase (indicator 16). However, these average loads vary greatly between regions, reflecting different types of operations and distances to market. Asia, for example, has a high proportion of passenger ferry operations and an average load of only 2,313 tonnes, while Africa on average has longer journeys made by larger vessels and an average load of 15,681 tonnes.
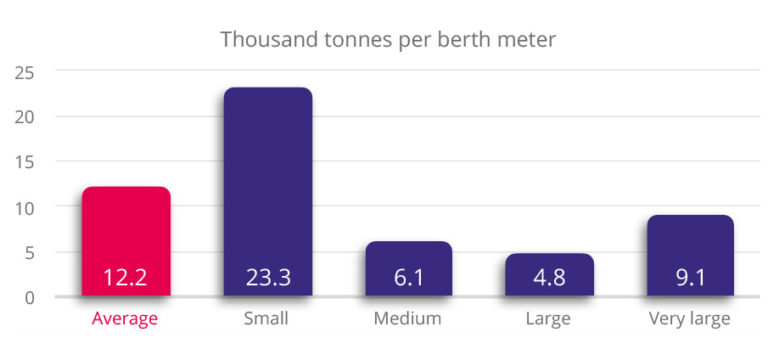
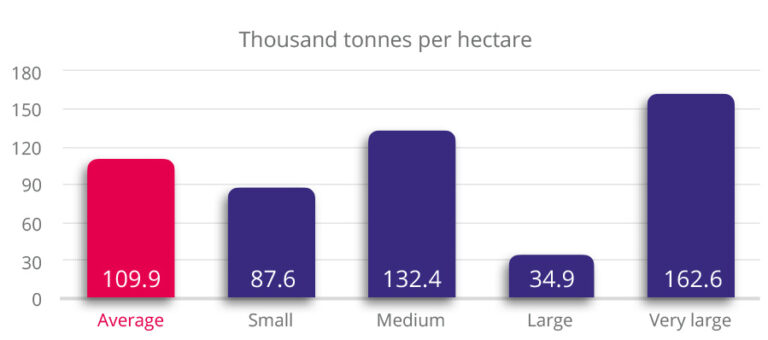
Space is a limiting factor for many ports, especially those situated within major cities. Maximising the productivity of that space is an imperative. These data show much higher productivity rate measured as tonnes of cargo per berth meter for small ports compared to all other categories. The picture is less clear when looking at productivity in terms of total land available as other variables such as local geography and other commercial activities on port estates can explain the outcomes.
Gender
The platform continues to collect data on female participation in the port entity workforce. In the past we have observed a low global average participation rate and this is still the case at 18%. Europe is significantly higher at 25% although far from an equal distribution of roles. The global averages for management and administrative roles are more encouraging as they have increased to 42% (38% in the 2020 scorecard for years 2015-2019). Europe is below this average at 39% with Asia leading the way at 52%.
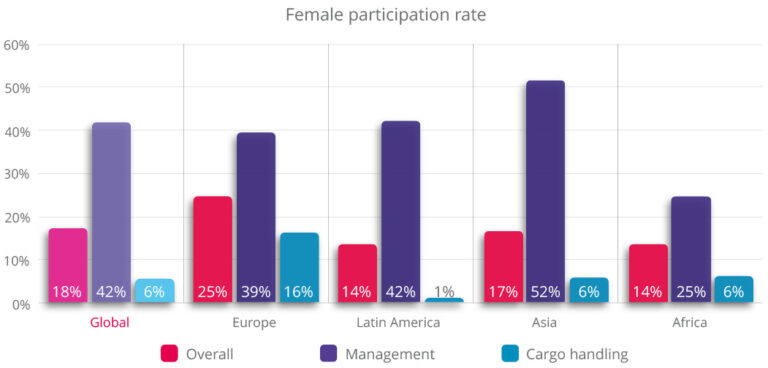
When cargo handling and port operations are examined there is a marked drop off in the participation rate. The numbers highlight the need for strategic policy inter- ventions to improve on the SDG target to “Achieve gender equality and empower all women and girls”.
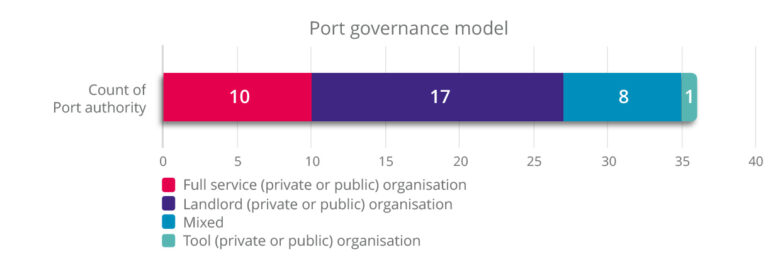
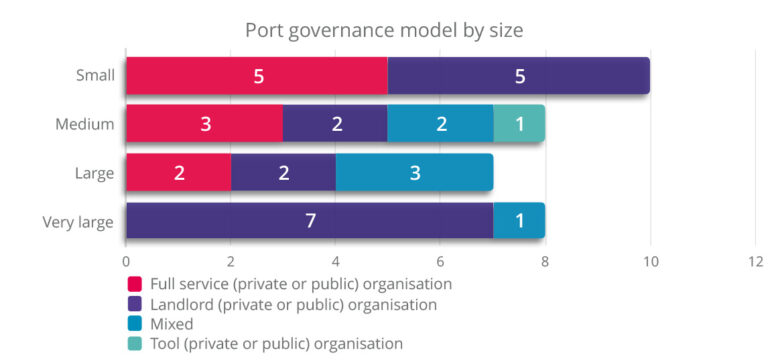
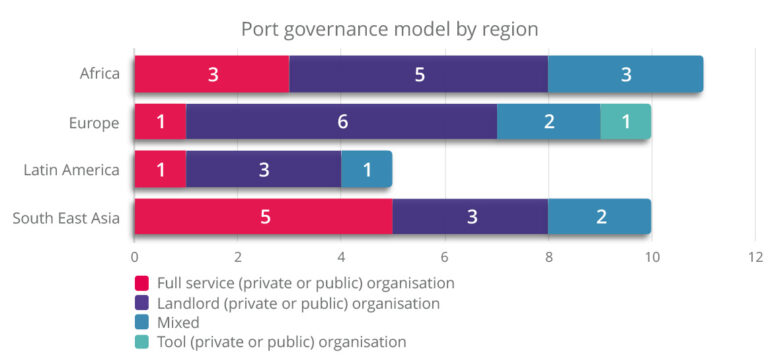
Governance model
The data shows that 67% of ports in the dataset function as landlord ports or as a mixed model with significant elements of landlord structures in place. For example, the typical mixed model port applies a landlord model to container operations and different solutions for other cargo types. Most of the very large ports, that is greater than 25 million tonnes per annum, are reported as a landlord operation. Regionally, ports in Europe and Latin America are more likely to be landlord entities with Asia reporting a higher proportion of full-service ports. Ports in Africa are more likely to be landlord or mixed type ports.
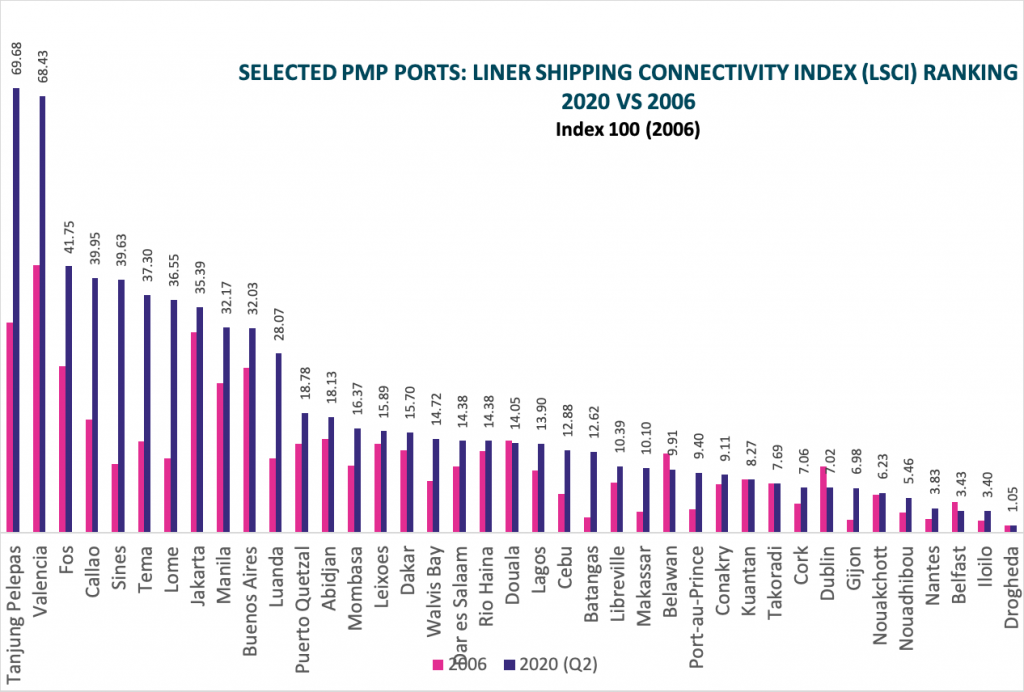
UNCTAD’s liner shipping connectivity index (LSCI)
The chart below represent a selection of ports that are members of the TrainForTrade Port Management Programme and for which the LSCI is indicated for 2006 (inception date) and for 2020 (latest data) by port. These data refer to the ports connectivity within contaianer networks and other modes are not included.
Data Partnership
Major improvements have also been conducted in terms of data consistency checks performed by TFT team with the support of data provided by MarineTraffic an UNCTAD partner for maritime statistics. Gross tonnage and total time in port are 2 of the main set of data utilised to operate checks in the pps platform.
Related Publications
-
Newsletter Desempeño Portuario 2021
Esta publicación presenta la Tarjeta de puntuación de rendimiento de puertos de la UNCTAD 2021 del Programa de gestión de puertos de TrainForTrade. (Disponible en inglés)
-
Newsletter Desempeño Portuario 2020
Esta publicación presenta la Tarjeta de puntuación de rendimiento de puertos de la UNCTAD 2019 del Programa de gestión de puertos de TrainForTrade. (Disponible en inglés) Newsletter 2020
-
Newsletter Desempeño Portuario 2019
Esta publicación presenta la Tarjeta de puntuación de rendimiento de puertos de la UNCTAD 2018 del Programa de gestión de puertos de TrainForTrade.
(Disponible en inglés)
-
Newsletter Desempeño Portuario 2018
Esta publicación presenta la Tarjeta de puntuación de rendimiento de puertos de la UNCTAD 2018 del Programa de gestión de puertos de TrainForTrade.
(Disponible en inglés)
-
Newsletter Desempeño Portuario 2017
La newsletter presenta la evaluación comparativa del desempeño portuario en el marco del Programa de Gestión Portuaria/TrainForTrade de la UNCTAD.
(Disponible en inglés)
Presentation 2021 of the PPS to Indonesia
Introduction by Mark Assaf, Presentation by Gonzalo Ayala, UNCTAD

Introduction by Mark Assaf, Presentation by Gonzalo Ayala, UNCTAD
Presentation by Dr Joseph HINEY,Chairman Drogheda Port Company
Linking performance indicators with strategic objectives
Presentation by Dr Joseph HINEY,Chairman Drogheda Port Company
Linking performance indicators with strategic objectives
Presentation by Juan M. Diez, Valenciaport : Strategic Planning & Innovation